Wastewater and Sewage Spill Prevention graphic
Project mapping sewage spills
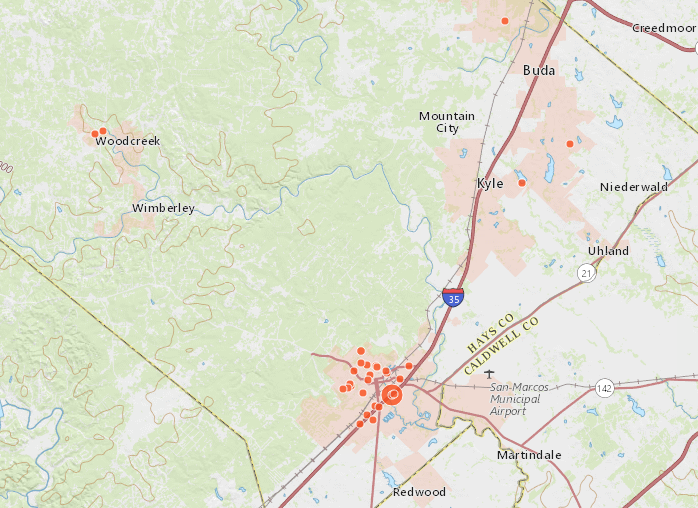
A Texas State University project unveiled in 2012 is mapping sewage spills in and near the Edwards Aquifer Recharge Zones. The project, called “Vulnerability Analysis and Visualization of Sewage Spills,” shows the location, size and causes of spills from 2012 through 2017 based on data received from the Texas Commission on Environmental Quality (TCEQ).
Texas State geography students Haylea Elliff, Joseph Berenji, Jasi Mitchell, Alexandra Thompson and Justin Williams updated an existing mapping project that showed spills from 2006-2012 in TCEQ Regions 11 and 12. The interactive map includes Hays, Bexar, Travis, Comal, Medina and Uvalde counties.
Of the spills that have occurred in those counties, 59 occurred in San Marcos. The year 2012 saw the most spills in San Marcos — 24 — ranging in size from 35 gallons to 430,000 gallons. The 430,000-gallon spill occurred along River Road on March 19, 2012, and was caused by an equipment failure, according to the report. Most of the other spills were caused by grease or other blockages in sewer lines.
In 2013, only 12 spills were recorded in San Marcos. Most were caused by blockages; many of those were grease clogs, but one was due to a dead raccoon blocking a sewage line.
There were no spills reported in San Marcos in 2014 and only six spills in 2015. Four of those spills were caused by “acts of God” during the Halloween weekend floods. In 2016, San Marcos experienced 10 spills, several of which were caused by some type of equipment failure, and in 2017 there were seven spills, the largest of which — 75,000 gallons — was caused by equipment failure. Debris blockages were a common cause of spills that year.
Jon Clack, assistant director of public services for the city’s water/wastewater utility department, said that sometimes electrical outages will cause equipment failures, but the city has schedules for both routine and preventive maintenance for its water and wastewater equipment.
“We have a program — our computerized maintenance management system — that sends out work orders,” he said.
The city also regularly performs maintenance on its pipes, including chemical treatments to help prevent grease blockages and cleaning out pipes in areas prone to blockages.
“We have areas that are known trouble spots,” Clack said, “and we hit them a little more often.”
The city recently started using a new technology — smart covers for manholes — to help detect blockages early, Clack said. The covers have sensors on them that monitor the flow below the manholes and alerts city workers if the level changes. If the level in the sewer rises, it means there is a block downstream; if it falls quickly, Clack said, that indicates a block upstream from the manhole.
“Those have worked really well for us,” he said.
Clack said that sometimes unexpected objects end up in the sewer system — often if someone has removed a manhole cover. He said city workers have found boards, cement blocks and other items in the sewer that block the flow. He also said that residents can help prevent blockages and resulting sewage spills and backups by being careful what they flush and by not putting any sort of grease down the sink. He recommended even wiping down greasy dishes before putting them in the dishwasher or hand washing them.
“You may not think you’re putting a lot of grease into the system,” he said, “but it combines with everyone else’s and catches on things.”
The interactive map of sewage spills can be found online.